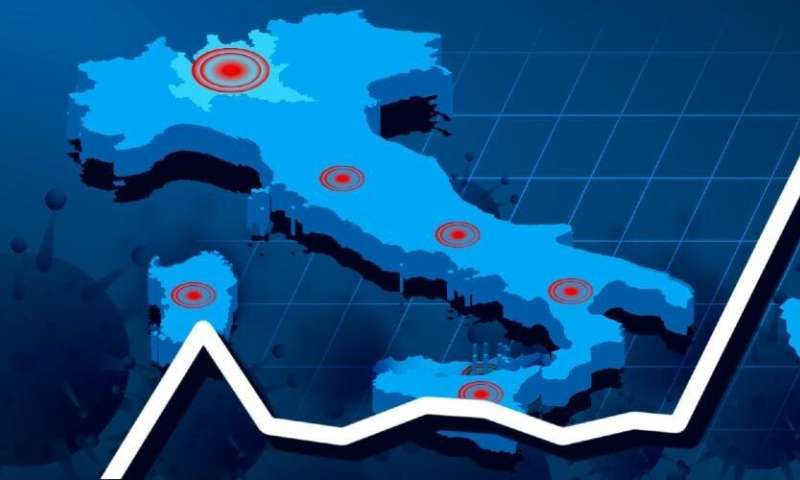
Real-time maps of COVID trends in Italy

Marco Bonetti, at Bocconi Department of Social and Political Sciences, and Ugofilippo Basellini (Max-Planck-Institut für Demografische Forschung) have developed Epilocal, an online tool designed to estimate and visualize differences in the spread and trends of the pandemic at the sub-national level, which has now been published in Demographic Research.
The real-time maps are available on the homepage of Bocconi COVID Crisis Lab.
The software uses official data at the province level and, through a manual or automatic choice of local statistical models, summarizes the trend that the epidemic has followed over the selected time period at the local level. The result is a graph for each province and region, including cumulative data on positive cases (or other variables) and a model-based curve. Next to the graph is an indication of the estimated relative growth rate of the curve on the last day of analysis.
This translates into three maps of Italy. In two of the maps, different nuances of blue correspond to different numbers of positive cases relative to the population and to different speeds of growth of the cases. A third map summarizes the two variables: each province corresponds to a circle, and the size of the circle corresponds to the number of events up to the day of the analysis, while the color of the circle indicates the speed of growth at the time of the map.
"The Epilocal software provides researchers and policymakers with a simple open-access, real-time tool to monitor the older and the most recent trends of the COVID-19 pandemic in the Italian regions and provinces," Prof. Bonetti says.
More information:
Marco Bonetti et al. Epilocal: A real-time tool for local epidemic monitoring, Demographic Research (2021). DOI: 10.4054/DemRes.2021.44.12
Provided by Bocconi University